The 2026 FIFA World Cup in North America offered a glimpse of a problem that major sporting events will increasingly have to confront: extreme weather is becoming a growing issue for games, players and stadium infrastructure.
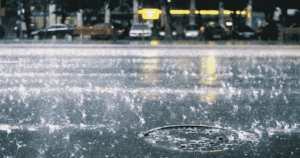
The tournament was held amid increasing concern about heatwaves, heavy rainfall, thunderstorms and lightning. In Philadelphia, the France–Iraq match became one of the clearest examples of how extreme weather events can disrupt a major football event. Heavy rain and thunderstorms extended the normal halftime interval by more than two hours, fans were moved away from exposed seating areas, and stadium operations were affected by the storm. The interruption was triggered by lightning-safety protocols.
The incident was more than an unusual football story. It was a warning about the growing complexity of hosting large outdoor events in a changing climate. The question is increasingly unavoidable: are stadiums and tournament operations being designed for the rainfall intensities of the past, while the most intense rainfall events of the future become more severe?
To help answer that, it is useful to compare the 1994 and 2026 World Cups. Five U.S. metropolitan markets provide a natural basis for comparison, since they hosted matches in both tournaments: Boston, Dallas, Los Angeles, New York and New Jersey, and the San Francisco Bay Area.
The comparison is not perfectly equal. The 1994 World Cup had 24 teams and 52 matches, while the expanded 2026 tournament had 48 teams and 104 matches — meaning 2026 created substantially more opportunities for extreme weather to affect games, fans and operations. Nevertheless, the comparison is valuable because the tournaments overlap geographically and occur during broadly comparable summer periods.
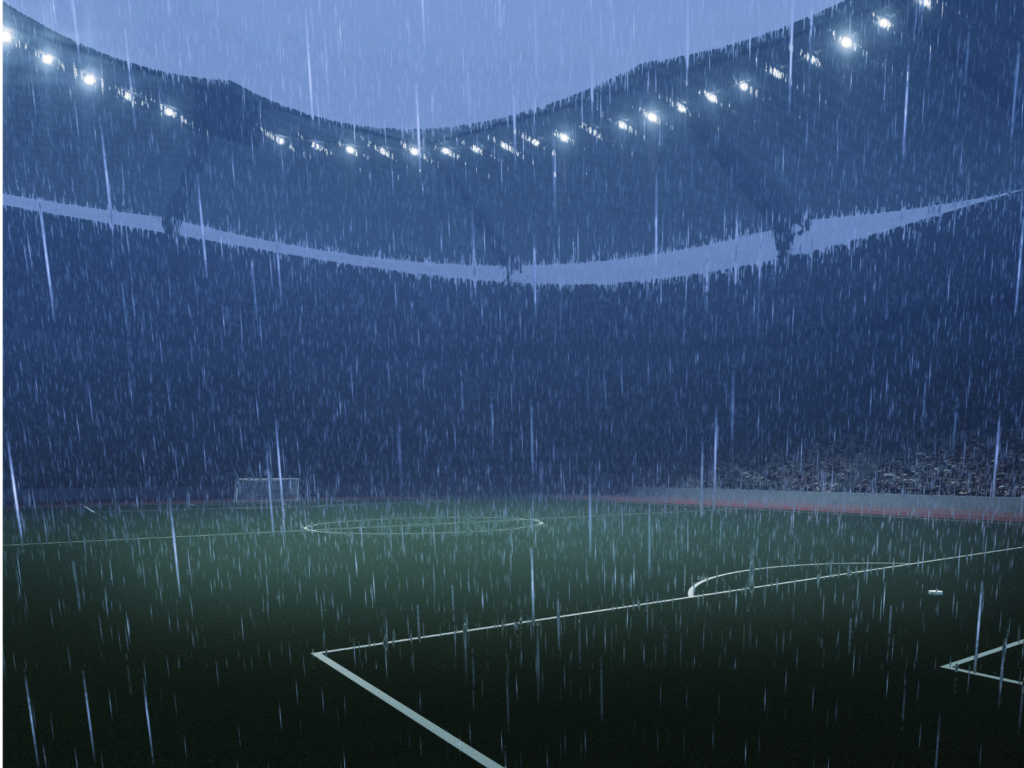
Why intensity of weather events is more Telling than totals
A simple comparison of monthly rainfall totals is not enough. For stadium design, the critical variable is rainfall intensity, not rainfall volume. One millimetre of rain falling gradually over two hours creates a very different engineering challenge from one millimetre falling in five minutes — the latter is equivalent to an hourly rainfall intensity of 12 millimetres per hour. A stadium can receive a relatively modest total amount of rain while still experiencing severe surface-water problems if that rain arrives within a very short period.
For that reason, the most useful comparison between 1994 and 2026 is not the total amount of rain recorded during each tournament, but whether the most intense short-duration rainfall events were more severe in 2026.
A robust analysis would compare rainfall during the match time frame, rainfall intensity during periods when rain was actually falling, and the maximum five-minute rainfall intensity recorded during each match — the measure most relevant to the type of short-duration rain that can overwhelm drainage systems and create sudden flooding.
The scientific evidence points toward more intense heavy rainfall events
The EPA makes an important point for infrastructure planning, stating that “even in regions of the United States that are expected to receive less precipitation overall, the precipitation that does fall will come in heavier bursts.” The IPCC reaches a similar conclusion at the global level, linking the intensification of heavy precipitation to the increased moisture that warmer air can hold.
Research published through NOAA’s research repository has also warned that traditional infrastructure design often assumes extreme rainfall statistics are stationary — that the past is a reliable guide to the future. In a warming climate, stadiums may face more severe conditions than historical records suggest, meaning a drainage system designed only around historical rainfall statistics may gradually become less conservative as climate conditions change.

How Extreme Weather Impacted the 2026 World Cup
The 2026 tournament provided a real-world demonstration of how extreme weather can disrupt a major football event. Three kickoff times were confirmed delayed specifically due to rain or thunderstorm activity through the Round of 16:
- France vs. Iraq (Philadelphia) – suspended for over two hours during severe weather.
- Mexico vs. Ecuador (Mexico City) – kickoff delayed by roughly an hour due to lightning and rain.
- Mexico vs. England (Mexico City) – kickoff delayed by an hour due to severe weather.
These are the delays that made headlines; there may have been additional shorter delays at other matches not widely reported, and separately, heat-related concerns over player safety in hot conditions ran throughout the tournament.
These incidents illustrated the interaction of several risks at once: heavy rainfall, lightning, spectator shelter, pitch drainage, match scheduling and player safety all became part of the same operational problem. The important point is that the rain did not have to make the pitch completely unplayable to create a major stadium problem — a storm can still force play to stop on lightning grounds alone, even while drainage systems are under maximum stress and fans need shelter. The Philadelphia delay demonstrated precisely this combination.

The 1994 vs. 2026 rainfall comparison
Design standards themselves have moved. NOAA’s Atlas 14 — the federal precipitation-frequency reference shows real increases in two of the five host regions:
- Boston/Foxborough (Northeast, Atlas 14 Volume 10, published 2015): much of Massachusetts has seen a 1- to 2-inch increase in the 24-hr/100-year storm compared to prior standards.
- Dallas (Texas, Atlas 14 Volume 11, published 2018): the central and coastal regions of Texas have shown an increase in occurrence and intensity of major storm events, with the Austin area realising a 2- to 2.5-inch increase in the 24-hr/100-year storm.
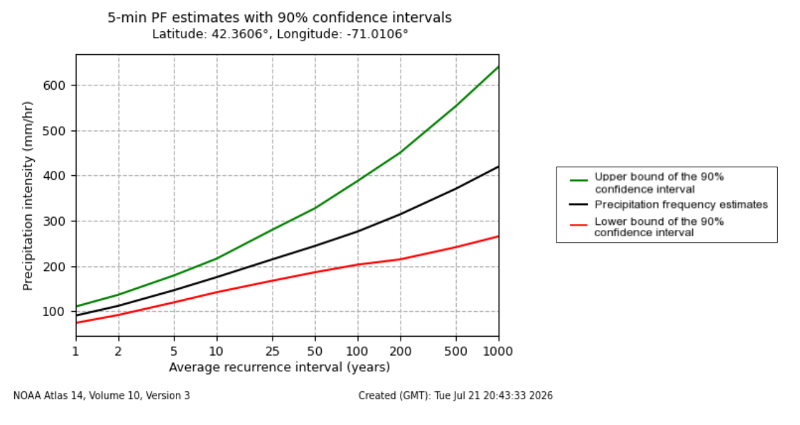
Image 1: In Boston, MA, the Point Precipitation Frequency shows the increase in the 5-minute rainfall intensities over the average recurrence interval.
Alongside that design-standard shift, the tables below lay out how conditions compared across the five repeat locations during the two tournaments themselves. The intensity figures in Tables 1 to 3 are estimated rather than measured station-level readings, so they are illustrative rather than precise instrumental data; Table 3’s monthly totals and the Atlas 14 figures above sit on firmer sourcing footing.
Table 1: Rainfall intensity intervals, 1994 vs. 2026
Location | 1994 intensity | 2026 intensity |
Boston | 4–8 mm/h | 8–15 mm/h |
Dallas | 6–12 mm/h | 10–20 mm/h |
Los Angeles | 3–6 mm/h | 5–10 mm/h |
New York/NJ | 5–10 mm/h | 8–16 mm/h |
San Francisco | 3–6 mm/h | 5–10 mm/h |
Table 2: Estimated average 5-minute rainfall intensity, 1994 vs. 2026
Location | Est. avg. 5-min intensity | Est. avg. 5-min intensity | Change |
Boston | 0.0 mm/h | 1.5 mm/h | 1.5 |
Dallas | 0.5 mm/h | 2.0 mm/h | 1.5 |
Los Angeles | 0.0 mm/h | 0.3 mm/h | 0.3 |
New York/NJ | 0.8 mm/h | 1.8 mm/h | 1.0 |
San Francisco Bay Area | 0.2 mm/h | 0.8 mm/h | 0.6 |
Table 3: Overall monthly rainfall in host cities (June)
Location | June 1994 | June 2026 | Change |
Boston | 0.86 in | 1.46 in | 70% |
Dallas | 2.61 in | 5.45 in | 109% |
Los Angeles | 0.06 in | 0.00 in | −100% |
New York/New Jersey | 3.21 in | 3.39 in | 6% |
San Francisco Bay Area | 0.06 in | 0.09 in | 50% |
The rainwater drainage problem: the stadium must manage water faster
A football stadium is essentially a large engineered rainwater drainage system. Water falls on the pitch, the roof, seating areas, walkways, access roads, parking areas and service areas — all of it must be collected and controlled. The design challenge is a race between rainfall inflow and drainage capacity: if rainfall arrives faster than the system can remove it, water accumulates.
The U.S. Climate Resilience Toolkit warns that extreme precipitation intensities can overwhelm stormwater systems, exceeding the capacity of existing drainage systems. For stadiums, the consequences can include standing water on the pitch, flooding in lower concourses, water entering electrical or mechanical areas, blocked emergency routes and unsafe pedestrian movement — problems that become mass-event safety issues when tens of thousands of people are inside a venue.
The response cannot simply be to install more drainage beneath the grass. A resilient stadium requires a whole-site water-management strategy: rapid pitch drainage, sufficient stormwater storage, redundant discharge routes and systems capable of handling water from roofs, concourses and surrounding hard surfaces. Where external systems can become overwhelmed, venues should have the capacity to temporarily store rainfall through underground tanks, detention basins or other controlled systems, and no drainage system should depend on a single pipe, pump or discharge route.
A future stadium also needs enough sheltered capacity to manage a prolonged weather delay, answering a simple but difficult question at the design stage rather than during the storm itself: where do tens of thousands of people go if the match stops and heavy rain continues for two hours?
The broader extreme weather challenge
Rainfall is only one part of the changing weather challenge. The 2026 tournament also generated significant concerns about heat and humidity, with analysis raising questions about player exposure during matches played in difficult conditions. Stadium infrastructure increasingly has to deal with multiple hazards at once — a single match can involve extreme heat before kickoff, high humidity, thunderstorms, lightning, heavy rainfall and flash-flood risk. The stadium of the future needs to be designed as a climate-resilient operating system, not simply as a bowl containing a football pitch.
The lesson from comparing weather patterns of 1994 with 2026
The comparison should not be reduced to a simplistic claim that there was a specific percentage more rain in 2026 than in 1994 — the current evidence does support a definitive five-minute rainfall-intensity increase in host cities.
The stadium of 1994 was designed for the climate and engineering assumptions of its time. The stadium of 2026 is operating in a different risk environment. The most important lesson is not simply that 2026 was wetter than 1994 — it is that a stadium can experience the same total rainfall it did in the past and still face a greater flood and operational risk if that rainfall arrives in shorter, more intense bursts.
That is why the next generation of World Cup venues should be designed around five-minute, fifteen-minute, thirty-minute and sixty-minute rainfall intensity, combined with future climate projections — with climate risk treated as a core consideration of tournament infrastructure.
References
- U.S. Environmental Protection Agency (EPA) — FIFA World Cup 2026 Host City Information
- Extreme Weather Watch — San Francisco: Average June Monthly Precipitation
- Extreme Weather Watch — Dallas: Average June Monthly Precipitation
- The Guardian — Flash floods and severe weather across the north-east United States (18 July 2026)
- NOAA National Weather Service — Precipitation Frequency Data Server (PFDS)
- BBC Sport — World Cup 2026: How thunderstorms could impact games
- National Library of Medicine (PMC) — Peer-reviewed research on extreme rainfall and climate change
- EarthArXiv — Preprint research on changing precipitation extremes and climate risk
- Taylor & Francis — International Journal of Sport Policy and Politics: Climate change and major sporting events (2026)
- LUT University — Climate adaptation and resilience research publication
- Google Scholar — Research on rainfall intensity trends in American cities
- Google Scholar — Additional peer-reviewed rainfall intensity research
- NOAA Climate Prediction Center
- NOAA National Centers for Environmental Information — Climate Data Online (CDO)
Find Out More About What We Do
Visit our sustainability page to learn more about sustainable rainwater management or get in touch with us below.
Written by
Meet Julia Cavanaugh
Sustainability & Technical Design Engineer