What the data tells us
Capcon Engineering tracks rainfall data across 15 cities in markets where they operate. The figures from the past five years are a lesson in how varied and volatile rainfall behaviour has become.
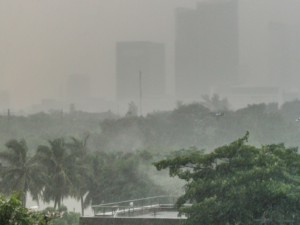
Predicting long-term rainfall behaviour in a changing climate is a demanding challenge those in the construction industry are facing today. Historical averages have provided a stable reference point for decades. But what the data now shows, across multiple geographies and climate types, is that rainfall patterns are shifting erratically. Some years are significantly wetter, others drier, and the extremes in both directions are becoming more pronounced. What is consistent is that when rainfall arrives, it presents as concentrated, high-intensity events — the kind that conventional gravity drainage systems were never designed to withstand.

Dublin’s long-term average (1991–2020) is 772.5mm annually. In 2023, Dublin Airport recorded 1,001mm — the wettest year on record since 2002, and 30% above the baseline used when designing drainage infrastructure in the buildings around it. By contrast, 2021 came in at just 666.7mm. A swing of over 330mm of rainfall in the same city is a structural threat that buildings must be prepared to face.
Oslo tells a similar story with greater intensity. The Norwegian capital’s 30-year average sits at 817.7mm. In 2023 it recorded 1,029mm. In 2024, 1,560mm — nearly double the historical norm. Northern Italy recorded 971mm in 2025 against a long-term average of 812mm. Sydney, whose 30-year baseline is 912mm, reached 2,530mm in 2022 before dropping back to 1,632mm in 2025. That 2022 figure is not a rounding error. It is nearly three times the historical average.
What is significant here is that year-on-year variation has become so pronounced that designing to a historical average is, in many cases, designing to a figure that may bear little resemblance to what a building will experience within its first decade of operation.

Looking further ahead
Historical data captures the weather events of the past. Climate projections tell us what’s coming — and the picture they paint reinforces the imperative need for buildings to plan for today’s volatile weather.
Analysis using Met Office projections indicates that Dublin’s December rainfall, which averaged 90.2mm over the 1981–2010 period, is projected to reach approximately 103mm by 2040 under median estimates. That is a considerable uplift on what was already a high baseline month.
Madrid offers a different perspective. December 2023 recorded just 17.8mm — a figure consistent with its historically dry climate. But median projections for December 2040 put that figure at around 50mm — nearly triple. For a city with drainage infrastructure that has been designed around consistently low rainfall, the data shows us that design plans going forward must be prepared for the unexpected.
The World Meteorological Organisation’s 2023 annual report adds broader context. Ireland recorded its warmest June in 124 years of observation. Extreme precipitation events are occurring with greater frequency and greater intensity across multiple regions simultaneously, displaying that the baseline itself is moving.

The problem with designing to averages
Most buildings are designed to manage a 1-in-100-year rainfall event. That calculation is typically based on historical intensity-duration-frequency data — in other words, the most extreme rainfall episode that statistical records suggest would occur once per century.
The difficulty is that those records are now incomplete as a basis for future design. When historical averages change, the 1-in-100-year event changes with them. A drainage specification that passed rigorous hydraulic modelling in 2005 using the data available at the time will not be able to support what the same location is expected to receive by 2040.
Conventional gravity drainage can compound this risk. These systems are designed around partial-flow conditions — pipes running at roughly one-third capacity — which means their theoretical flow rate in a standard test environment already assumes significant headroom. In practice, during high-intensity rainfall on a large roof area, that headroom disappears quickly. Water backs up, ponding increases, stressing the structural load on the roof. This makes the already narrow margin for error almost non-existent.
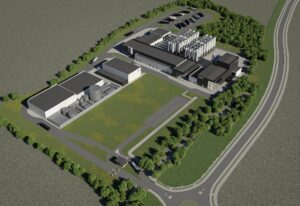
For large-roof buildings — distribution centres, airport terminals, data centres, healthcare facilities — this is an undeniably consequential engineering decision made at the specification stage.
Designing for the rainfall of today
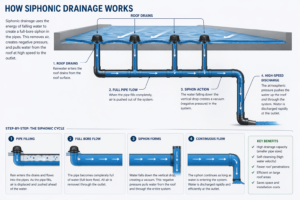
Siphonic drainage systems are engineered for peak-flow conditions. Rather than allowing water to trickle through partially filled pipes under gravity, siphonic systems create a negative pressure that pulls water off the roof at high velocity — up to six metres per second — through fully charged pipework. The entire system is sized to perform under maximum demand.
The hydraulic modelling behind each Capcon design accounts explicitly for local rainfall intensity data, 1-in-100-year event parameters and, critically, climatic change. The design is built around what the system will face, not what it has faced historically. For a project in Johor, Malaysia — where rainfall intensity runs at more than double that of most UK and European locations — the same engineering principles apply, calibrated precisely to local meteorological conditions.
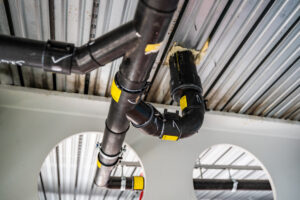
A modern drainage solution is not only practical in the face of climate change, but also cost-effective. Siphonic systems require significantly fewer downpipes than conventional gravity drainage, use smaller-diameter pipework and can be routed horizontally without falls. This frees up ceiling void space, simplifies coordination with mechanical and electrical services and reduces the number of penetrations through the building envelope. On large-scale projects, total installed cost typically comes in 20–40% below equivalent conventional systems, with lower maintenance demand over the asset’s lifetime.

The case for acting at design stage
Drainage is one of the earliest decisions locked in during the design process and one of the most difficult to revisit once a building is in use. Getting it right at concept stage — using current rainfall data, credible climate projections and rigorous hydraulic modelling — costs a fraction of what remediation costs later.
The data Capcon tracks across its global markets actively informs how its specialist team approaches every project. It is the difference between a drainage system sized for the world as it was and one sized for the world as it is — and as it is becoming.
Find Out More About What We Do
Contact Capcon Engineering to discuss your project’s specific drainage requirements with our specialist team.
References
-
Amsterdam, Netherlands — NOAA Global Summary of the Month, station NLE00101920:
- 2021 NOAA data
- 2022: URL incomplete — access via NOAA data search
- 2023 NOAA data
- Copernicus / EGUsphere reference
- Athens, Greece
- Hellenic National Meteorological Service
- MDPI Climate journal — Greek climate trends
- 2021 NOAA data
- 2022: URL not available — access via NOAA data search
- 2023 NOAA data
- Berlin, Germany
- Crete, Greece — NOAA Global Summary of the Month, station GR000016754:
- Dublin, Ireland
- Dubai, United Arab Emirates
- Madrid, Spain
- Northern Italy / Ghedi
- Oslo, Norway
- Paris, France — NOAA Global Summary of the Month, station FRM00007156:
- São Paulo, Brazil — NOAA Global Summary of the Month, station BR00E3-0520:
- Singapore
- Sweden / Piteå
- Sydney, Australia
- Tokyo, Japan
Written by
Meet Julia Cavanaugh
Sustainability & Technical Design Engineer